CRM reporting: the six reports a sales leader should open every Monday.
What came in, what moved, what stalled, what's at risk, who's overloaded, and what closed. What each report should show, and exactly how to build it in HubSpot and Pipedrive.
 Toni MedicSalestructSeptember 30, 202615 min readCRM & Pipeline
Most CRM dashboards are built once, during onboarding, and never touched again. They show whatever the default template shipped with: a funnel chart, a leaderboard, a revenue number. None of that tells a sales leader what to do on Monday morning. This is a method for building six reports that do: what came in, what moved, what stalled, what's at risk, who's overloaded, and what closed. Each one is a question with a pass or fail answer, and each one is buildable today in HubSpot or Pipedrive, at a named plan, from a named report or property.
The short version
- Six questions, six reports: what came in, what moved, what stalled, what's at risk, who's overloaded, what closed. A dashboard missing any one of them has a blind spot, not just a gap.
- "Stalled" and "at risk" are different failures and need different reports. Stalled is a deal that has sat in one stage too long. At risk is a deal whose close date has already passed while it is still open. HubSpot and Pipedrive both build these from different mechanisms.
- HubSpot's Sales Analytics Suite (Deals created, Deal funnel, Deal velocity, Deals won & lost, and more) is on Sales Hub Starter, not gated to Professional. What is gated to Professional is the flexible custom report builder for anything outside those pre-built shapes.
- Pipedrive's Insights reports are on every plan including Lite. What is gated is depth: multiple dashboards from Premium, and deal revenue forecast from Premium (product revenue forecast is Growth).
- Both platforms will build all six reports from list price. Neither one builds a report that tells you why a deal stalled. That's a conversation, not a query, and no dashboard replaces it.
How this guide was built
Every report name, property and plan requirement below was read from HubSpot's and Pipedrive's own documentation on 29 September 2026: their knowledge-base articles, plan comparison pages and pricing tables. Salestruct isn't a partner or reseller of either company. We build reporting on both, which is why this is written around the six questions a sales leader actually asks rather than around a feature list.
Three things to know before you build any of this:
- Plans named are Sales Hub for HubSpot (Free, Starter, Professional, Enterprise) and the current Pipedrive lineup (Lite, Growth, Premium, Ultimate), which replaced the old Essential/Advanced/Professional/Power/Enterprise names in 2025. Every Pipedrive page cited below already uses the current names.
- Worked numbers below are illustrative, built to show how to read the six reports together, not a real account's data.
- "Not published" means we looked and the vendor doesn't say, not that we didn't check.
What came in this week?
The first question is volume: how many new deals or leads entered the pipeline, and where did they come from. If this number drops and nobody notices for three weeks, every report after it is measuring a shrinking pipe.
| Platform | Build it with | Plan | What it shows |
|---|---|---|---|
| HubSpot | Deals created report, Sales Analytics Suite | Starter, Professional, Enterprise | Count of deals created, per user or team, over the period you choose |
| HubSpot | Deal revenue by source report, Sales Analytics Suite | Starter, Professional, Enterprise | Total deal amount by owner or team, split by the deal's original source |
| Pipedrive | Lead performance report, Insights | Available on every plan | Leads by status, source, owner and custom fields |
| Pipedrive | Deal performance report, Insights | Available on every plan | Won, lost and open deals, so a new-deal count can be read alongside outcomes |
Build both HubSpot reports from the same suite: Deals created answers "how many," Deal revenue by source answers "from where." Run them side by side, because a healthy count from a shrinking source is a different problem than a shrinking count overall.
What moved through the pipeline?
Volume in means nothing if nothing advances. This report reads stage-to-stage conversion, not just a snapshot of where deals sit today.
| Platform | Build it with | Plan | What it shows |
|---|---|---|---|
| HubSpot | Deal funnel report, Sales Analytics Suite | Starter, Professional, Enterprise | Deals per stage, stage skips, conversion rates and time spent in each stage |
| HubSpot | Deal change history report, Sales Analytics Suite | Starter, Professional, Enterprise | Every change to a deal's stage, amount or close date inside the period, plus deals created |
| Pipedrive | Deal conversion report, Insights | Available on every plan | How deals move through the pipeline, read as conversion rates between stages |
| Pipedrive | Deal progress report, Insights | Available on every plan | Deal movement through stages over time, read as momentum rather than a single snapshot |
The HubSpot Deal funnel report is worth reading past its headline chart: the stage-skip count catches reps who jump a deal straight to "proposal sent" without doing the stage's actual work, which a simple stage-count dashboard hides completely.
What's stalled?
This is the report almost nobody builds, and it's the one we rate highest of the six, because a stalled deal costs exactly as much pipeline as a lost one while still counting as "open" on every other report.
HubSpot and Pipedrive solve this with genuinely different mechanisms, and the difference matters for which one you build first.
HubSpot calculates it per deal, automatically, with two default deal properties:
- Time in current stage: the time the deal has spent in its current pipeline stage, recalculated live.
- Is Stalled After Timestamp: a timestamp HubSpot sets automatically the moment a deal's time in its current stage exceeds 20% longer than that deal owner's own closed-won average for that same stage. It compares the deal against the rep's own normal pace, not a fixed number of days.
Build the report by filtering the Deals index (or a saved view) on Is Stalled After Timestamp is known, which surfaces every deal currently past its own threshold. For an aggregate view across the team, the Sales Analytics Suite's Time spent in deal stage report (Starter and up) shows average time in a stage by rep or team, so you can see which stage is the actual bottleneck before you go deal by deal.
Pipedrive calls this Deal Rotting: a deal is marked rotten after a set number of days with no activity logged against it. The rot clock resets when an activity is marked done, or when a note, file or email is added, and it ignores activities scheduled for the future. It's available on every plan, including Lite, with no report-builder step required, which makes it the faster of the two to see for the first time. Pair it with the Deal duration report (Insights, every plan) for how long deals spend in each stage in aggregate.
Stalled is a stage problem. It answers "where in the process did this deal stop moving," not "will it still close on time." That's the next report.
What's at risk?
At risk is a narrower, sharper question than stalled: is this deal's close date already in the past while the deal is still open? A deal can be perfectly on pace inside its current stage and still be forecasting revenue that was supposed to land two weeks ago.
Neither platform ships this as a named pre-built report. Both build it from a filter on the deal's own close-date field, which every plan on both platforms can set.
| Platform | Build it with | Plan | The filter |
|---|---|---|---|
| HubSpot | Saved view or filter on the Deals index | Available on all products and plans | Close Date is less than today, and Deal Stage is not any of your closed-won/closed-lost stages |
| Pipedrive | Advanced filter on Deals | Available on all products and plans | Expected close date is before today, and Status is Open |
Save either one as a shared view so the whole team sees the same list, not just the manager. A deal that clears this filter every Monday for three weeks running is not a reporting problem: it's a deal nobody has re-qualified.
Who's overloaded?
The same six deals can mean very different things depending on which rep holds them. A rep sitting on 40 open deals and a rep sitting on 8 are not doing the same job, even if both hit quota last quarter, and an overloaded rep is where deals start stalling in bulk.
| Platform | Build it with | Plan | What it shows |
|---|---|---|---|
| HubSpot | Deal owner quick filter on the Deals index | Starter, Professional, Enterprise (Free excluded) | Isolate one rep's open deal count and value at a time |
| HubSpot | Custom report builder, grouped by deal owner | Professional, Enterprise | One report comparing every rep's open deal count and value side by side |
| Pipedrive | Activities performance report, Insights | Available on every plan | Activity volume and outcomes per user, including which activities are completed or overdue against their due dates |
On HubSpot's lower tier this means clicking through each rep one at a time with the quick filter; on Professional and up, the custom report builder puts every rep in one grid. On Pipedrive, Activities performance is the proxy for load: a rep whose overdue-activity count is climbing is the rep whose deals will show up on the stalled report next.
What closed?
The report every CRM builds by default, and the only one of the six that gets checked without being asked for. Worth including here anyway, because it's what the other five exist to protect.
| Platform | Build it with | Plan | What it shows |
|---|---|---|---|
| HubSpot | Deals won & lost report, Sales Analytics Suite | Starter, Professional, Enterprise | Count of deals won and lost, by user or team |
| HubSpot | Deal loss reasons report, Sales Analytics Suite | Starter, Professional, Enterprise | Count of closed-lost deals and their value, grouped by the Closed lost reason property, per owner or team |
| HubSpot | Deal velocity report, Sales Analytics Suite | Starter, Professional, Enterprise | Average number of days deals with a close date in range took to close, by user or team |
| Pipedrive | Deal performance report, Insights | Available on every plan | Won, lost and open deals tracked across the pipeline |
Deal loss reasons is the one worth pinning next to the stalled report rather than filing away at month end: if the same reason keeps recurring on deals that were also flagged stalled, the stage itself is the problem, not the individual rep.
Forecasting, once the six reports are clean
Forecasting sits downstream of all six questions above, and both vendors gate it higher than the base reports:
Forecasting
Checked 29 September 2026

Forecast tool
Edge: HubSpot
Sales Hub Professional and Enterprise. Enterprise adds forecasting across team hierarchiesNot a separate tool; built from the reports belowProduct revenue forecast
Edge: Pipedrive
Not published as a named reportGrowth and higher plansDeal revenue forecast
Edge: Even
Covered by the Forecast tool abovePremium and higher plansMultiple dashboards to hold these reports
Edge: HubSpot
Free 10, Starter 30, Professional 75, Enterprise 100Lite and Growth: the default dashboard only. Premium and Ultimate: multiple dashboardsRead from: HubSpot Product and Services Catalog · Pipedrive Insights report types.
A forecast built on top of deals that are already stalled or already past their close date is not a forecast, it's an extrapolation of a number nobody has checked. Build the six reports above first.
A worked Monday, walked through
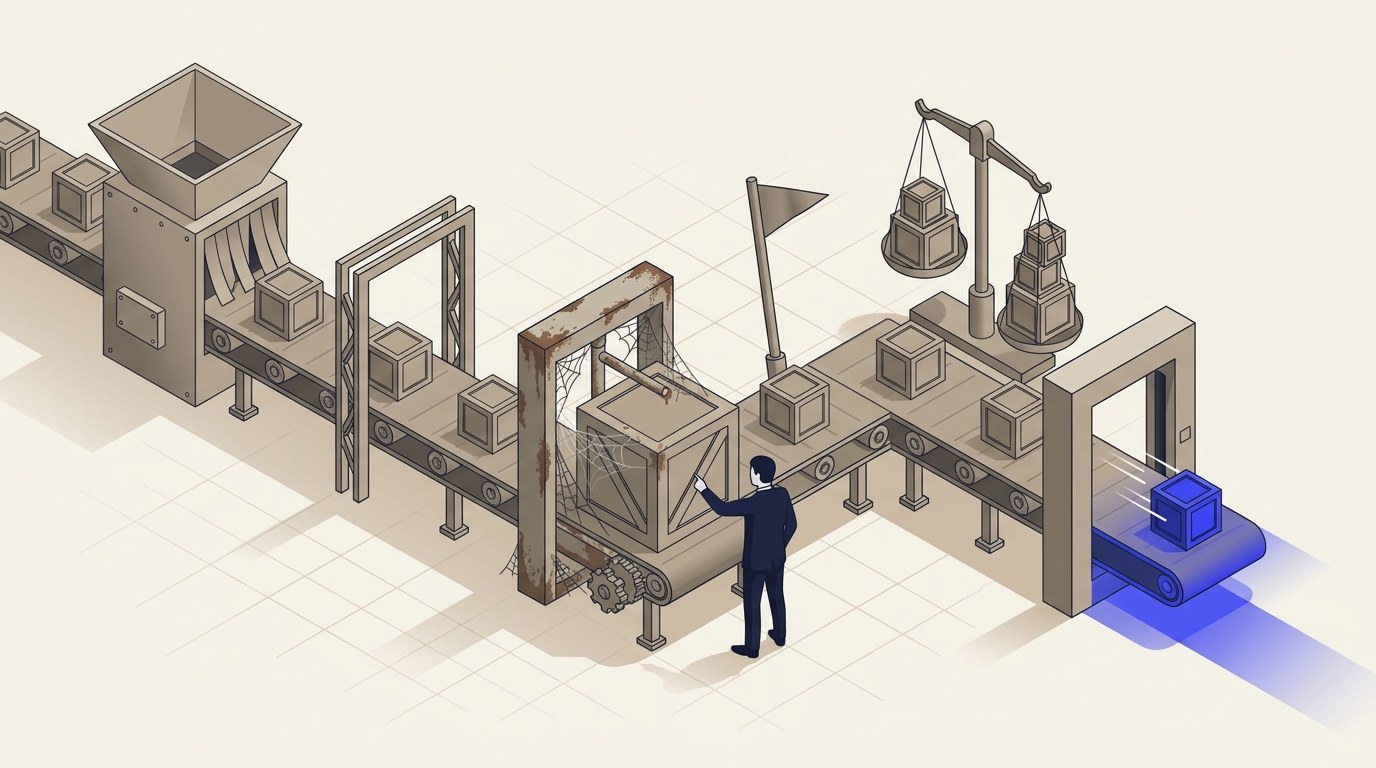
Here's how the six reports read together on an illustrative six-person team, numbers built to show the method rather than a real account:
- What came in: 34 deals created this week, down from a 52-deal average
Deal revenue by source shows the drop is entirely in one channel. That's the first flag: not "pipeline is down," but "one source stopped."
- What moved: conversion from stage 2 to stage 3 fell from 61% to 38%
The Deal funnel report's skip count is flat, so reps aren't jumping stages to hide the problem. The stage itself is where deals are getting stuck.
- What stalled: 11 deals are past their Is Stalled After Timestamp, 9 of them in stage 3
That's the same stage the funnel report just flagged. Two reports independently pointing at the same stage is a stronger signal than either alone.
- What's at risk: 4 open deals have a close date already in the past
Two of the four are also on the stalled list. Those two get re-qualified on a call today, not re-forecast on a dashboard.
- Who's overloaded: one rep holds 6 of the 9 stalled stage-3 deals
Activities performance for that rep shows overdue activities climbing for two weeks straight. The stalled deals aren't a skill problem, they're a capacity problem.
- What closed: won count is flat, but average deal velocity slowed by 4 days
Nothing closed lost this week, which is why nobody flagged a problem before running the other five reports. The pipeline was already leaking; it just hadn't shown up as a loss yet.
The action out of that Monday isn't "check the dashboard again next week." It's one conversation with one rep about stage 3, and one call each to the two deals that are both stalled and overdue on close date.
Where this breaks
- A stalled-deal report only works if reps log activity honestly. Pipedrive's rot clock resets on a note, file or logged email exactly as easily whether the contact was really touched or a rep just wants the flag to clear. The report catches inaction, not fake activity, and it needs a manager who spot-checks rather than trusts the flag alone.
- HubSpot's 20% threshold moves with the rep. Is Stalled After Timestamp compares a deal against that specific owner's own closed-won average for the stage. A rep with a slow personal average gets a more forgiving stall threshold than a fast one, which is fair to the rep and can hide a genuinely slow stage if every rep on it is equally slow.
- None of these reports explain why. They tell you which deal, which stage, which rep. The reason a deal stalled, whether it's budget, a champion who left, or a rep who dropped the ball, only comes out on a call. A dashboard that gets read instead of a pipeline that gets called is the most common way this method fails in practice.
- Custom reporting depth costs more on both platforms. HubSpot's flexible custom report builder needs Professional; Pipedrive's deal revenue forecast needs Premium. The six reports above run on the lower tiers on both platforms; going further into cross-object or custom-field reporting does not.
Which build fits which team
| If your team... | Start with | Because |
|---|---|---|
| Is on HubSpot Starter or below | Deals created, Deal funnel, Time spent in deal stage, Deals won & lost | All four are in the Sales Analytics Suite at Starter; no Professional upgrade needed to get five of the six questions answered |
| Is on Pipedrive, any plan | Deal Rotting plus an Expected close date filter | Both work on Lite with zero configuration, and together they cover stalled and at-risk without touching Insights |
| Has more than one rep per manager | The Deal owner quick filter (HubSpot) or Activities performance (Pipedrive) | Overload is invisible until it's read per rep, not as a team total |
| Is already forecasting off the CRM | Confirm the six reports are clean first | A forecast tool sitting on top of unflagged stalled and at-risk deals inherits their error |
Sources
HubSpot, Create sales reports in the sales analytics suite, last updated 18 June 2026. Deals created, Deal funnel, Deal change history, Deal loss reasons, Deal pipeline waterfall, Deal push rate, Deal velocity, Deals won & lost, Sales velocity, Time spent in deal stage, Deal revenue by source (2026)
HubSpot, HubSpot's default deal properties, last updated 29 September 2026. Is Stalled After Timestamp, Average Deal Owner Duration In Current Stage (2026)
HubSpot, Use stage calculated properties, last updated 15 July 2026. Time in current stage, Date entered current stage (2026)
All 13 sources and how they were checked
HubSpot, View and filter records, last updated 5 September 2026. Saved views and filters on index pages, all products and plans (2026)
HubSpot, Customize index page quick filters, last updated 2 September 2026. Starter, Professional, Enterprise (2026)
HubSpot, Create custom reports, last updated 8 June 2026. Custom report builder gated to Professional and Enterprise (2026)
HubSpot, HubSpot Product and Services Catalog, read 29 September 2026. Dashboard limits and Forecasting tool by Sales Hub tier (2026)
Pipedrive, Insights: report types, last updated 3 September 2026. Lead performance, Deal performance, Deal conversion, Deal duration, Deal progress, Activities performance, Product and Deal revenue forecast plan gating (2026)
Pipedrive, The Rotting feature, last updated 3 September 2026. Rot clock and activity reset conditions (2026)
Pipedrive, What features do the Pipedrive plans have, last updated 3 September 2026. Deal rotting and Insights confirmed on every plan including Lite (2026)
Pipedrive, Advanced filtering, last updated 3 September 2026. Filter conditions on the Deals list, pipeline and forecast views (2026)
Pipedrive, Insights dashboards, last updated 3 September 2026. Dashboard counts per plan (2026)
Pipedrive, Pricing and Compare plans table, read 29 September 2026 (2026)
Every report name, property and plan requirement on this page was read from the vendor's own documentation on 29 September 2026 and is linked above. Plans and report names change; if a detail here disagrees with the vendor's current page, the vendor's page is right. Salestruct has no commercial relationship with HubSpot or Pipedrive.
Common questions
Building these six reports takes an afternoon in either platform. Reading them together, every week, without letting the "what closed" number distract from the other five, is the part that actually protects pipeline.
Related reading: HubSpot vs Pipedrive, CRM pipeline stages and exit criteria, CRM hygiene: measure your decay rate, Revenue operations KPIs your CRM cannot calculate.
If you want a second pair of eyes on your own setup, Salestruct runs a free diagnostic.
Read next.
All articlesHubSpot vs Pipedrive: which CRM for a sales team?
Every plan, limit and price, read from each vendor's own pages on 29 September 2026: interface, automation, webhooks, API, integrations, AI, security, support and year-one cost at 5 and 15 seats.

CRM pipeline stages: give every one an exit criterion
Your CRM ships with stages named after things your rep did, and it multiplies your forecast by a number attached to each one. Booking a presentation does not make a deal 60% likely to close, but that is what the default pipeline asserts.